Where Are Massachusetts Public Schools Struggling?
A statewide analysis of academic performance disparities
An analysis of 1,800 Massachusetts public schools. Identified nine underperforming districts, found that 10th-grade math performance is more strongly correlated with college readiness than class size, and recommended Brookline Public Schools as a research model for math instruction.
Brief
Massachusetts is regularly ranked the highest-performing public school system in the United States. That state-level ranking conceals significant district-level variation: some districts are world-class, while others are persistently struggling on every measure that matters.
The question: where, specifically, is performance breaking down — and what does it correlate with?
The audience would be state-level decision-makers — Department of Elementary and Secondary Education (DESE) leadership, legislators, and district superintendents — who set funding allocations and intervention policies.
Approach
I worked from publicly available Massachusetts Department of Elementary and Secondary Education data covering all 1,800+ public schools across the state, spanning enrollment demographics, MCAS performance (3rd, 8th, and 10th grade), graduation rates, and college matriculation outcomes.
The analysis had three steps. First, descriptive segmentation to identify which districts were underperforming and on what dimensions. Second, correlation analysis to test which performance indicators were most strongly correlated with downstream outcomes (graduation rates, college matriculation). Third, comparison against high-performing peer districts to identify a research model for intervention.
The output was a five-slide presentation designed for a non-technical audience — state leadership and district administrators — emphasizing clear narrative over methodological detail.
Dashboard Walkthrough
Runtime: 22 mins
Nine districts struggle on every measure
Defining "struggling" was the most consequential decision in the analysis. I used three publicly observable outcome measures — graduation rate, dropout rate, and college attendance rate — and defined struggling as bottom-decile (or top-decile, in the case of dropout) on each. Using the same decile threshold across all three measures gave the department a defensible, transparent definition they could either accept or substitute their own threshold for without invalidating the rest of the analysis.
Each measure produced a different list. 24 districts had schools in the bottom decile for graduation. 26 had schools in the top decile for dropout. 34 had schools in the bottom decile for college attendance.
Only nine districts appeared on all three lists:
Boston
Brockton
Fall River
Holyoke
Lawrence
Lowell Middlesex Academy Charter
Lynn
Revere
Wareham

*These nine are the highest-leverage targets for intervention: districts where students are failing across three independent measures, suggesting systemic rather than measure-specific causes. Treating them as a single learning cohort rather than nine isolated cases concentrates limited resources where the cross-measure evidence is strongest."
What correlates with college attendance — and what doesn't
The department asked specifically whether class size affects college attendance. The intuition is reasonable — smaller classes, more attention, better outcomes. The data did not support it.
Plotting average class size against college attendance for every Massachusetts school produced a cloud, not a slope. Schools with average class sizes around 16 (the state norm) varied widely in college attendance, and the schools at the extremes of class size showed no consistent directional pattern. This finding is consistent with the Massachusetts Department of Elementary and Secondary Education's own 2017 study, which concluded that the impact of smaller class size had been overstated and that teacher quality was a stronger factor in student achievement.
10th-grade math performance was a different story. Plotting the percentage of students scoring Pass or Advanced on the 10th-grade math MCAS against college attendance produced a clear positive correlation — the higher a school's math proficiency, the higher its college attendance rate. This aligns with prior research from DESE and the Annenberg Institute at Brown showing that 70%+ of students scoring Pass or Advanced on the 10th-grade MCAS enroll in college immediately after graduation.
The practical implication: if the department's goal is to increase college attendance, math instruction has stronger correlational evidence than class-size reduction. Class size is a costly intervention with weak evidence; math proficiency has strong evidence and a closer alignment with the outcome the department cares about.

% attending college plotted against class size (left) and 10th-grade math MCAS Pass+Advanced rate (right). Each point is a Massachusetts public school. Class size shows weak, inconsistent association; 10th-grade math shows a clear positive correlation.
Where to look for what's working: Brookline
If 10th-grade math is the strongest available correlate of college attendance, the natural follow-up is: where does math instruction work, and what can be learned from it?
8th-grade math is the right place to look. Research from DESE, the Harvard Graduate School of Education, and the Annenberg Institute has found that 8th-grade math performance is highly correlated with 10th-grade performance — meaning 8th-grade scores function as an early warning signal for schools trending off-track. Districts could use 8th-grade math to flag schools that need earlier intervention
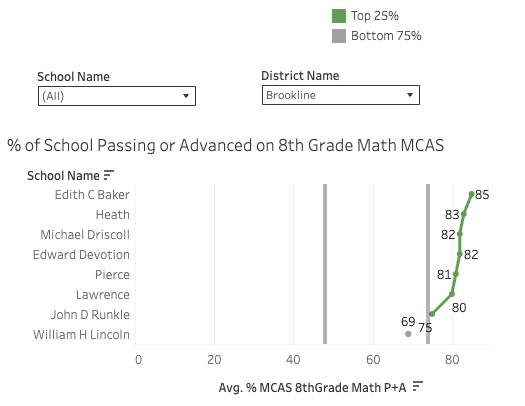
Across the state, 34 schools in 25 districts scored in the top 25% on the 8th-grade math MCAS. One district stood out: Brookline Public Schools had seven schools in that top quartile — more than any other district in the Commonwealth.
This is a research recommendation, not a direct intervention. Brookline's demographic and resource profile differs significantly from the nine struggling districts, and a one-to-one transplant of practices is unlikely to work. But studying what Brookline does in 8th-grade math — curriculum, teacher development, instructional time, intervention triggers — and surfacing the transferable elements gives the department a starting point for the math-instruction strategy that the 10th-grade correlation pointed to.