Pay Isn’t the Problem
An analysis of IBM employee attrition
A logistic regression analysis of IBM's 16.1% attrition rate that overturned the initial hypothesis about compensation, identified the actual drivers, and produced a self-funding intervention recommendation projected to reduce attrition by approximately 27%.
The Problem
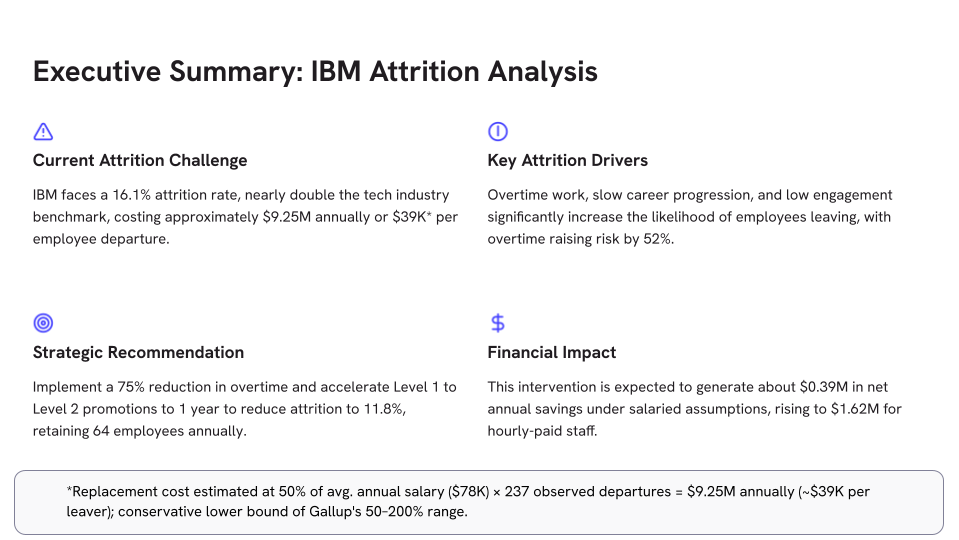
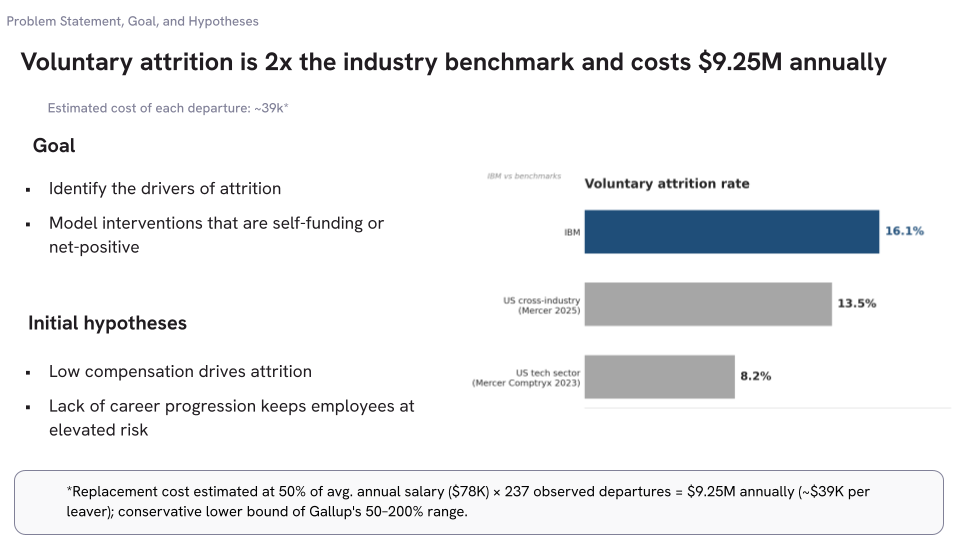
IBM faced a 16.1% voluntary attrition rate in the analyzed dataset — nearly double the US tech industry benchmark of 8.2% (Mercer Comptryx 2023). Replacement costs at the conservative lower bound of Gallup's 50–200% range — roughly $39K per departure on a $78K average salary — added up to approximately $9.25M annually across 237 observed departures.
Initial Hypotheses
Going in, I expected compensation to be the primary driver. The reasoning was straightforward: if attrition was that high relative to peers, the most parsimonious explanation was that pay was below market. I added a second hypothesis as a hedge — that lack of career progression kept employees at elevated risk — and went into the analysis expecting the first to dominate. The analysis disconfirmed both expectations.
Method
I worked from a structured decision-making method: define and validate the problem, align on goals, generate options, evaluate against criteria, recommend with projected impact.
The analytical core was a logistic regression with SMOTE class balancing, fit on five validated predictor variables. Pay was excluded from the final model due to high correlation with Job Level (r = 0.95) — a multicollinearity issue that would have inflated standard errors and obscured the independent effects I was trying to estimate. The pay-related effect is captured indirectly through the Job Level variable and addressed through the promotion lever in the recommendation.
Probability reductions reported below are anchored to the 16.1% observed baseline rather than to model-internal odds ratios, so the magnitudes are interpretable in business terms.
Findings: three drivers, each independent
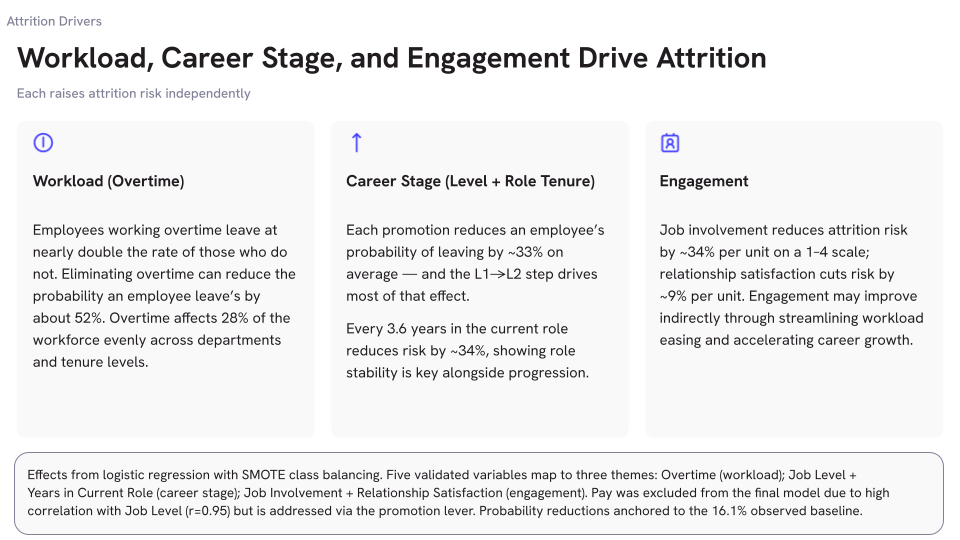
Workload (Overtime) Employees working overtime left at nearly double the rate of those who didn't. Eliminating overtime reduced the modeled probability of leaving by approximately 52%. Overtime affected 28% of the workforce evenly across departments and tenure levels.
Career Stage (Level + role tenure) Each promotion reduced an employee's probability of leaving by ~33% on average — and the L1→L2 step drove most of that effect. Every 3.6 years in current role reduced risk by ~34%, indicating that role stability matters alongside progression.
Engagement Job involvement reduced attrition risk by ~34% per unit on a 1–4 scale; relationship satisfaction reduced risk by ~9% per unit. Engagement may improve indirectly through workload reduction and career acceleration rather than through direct interventions.
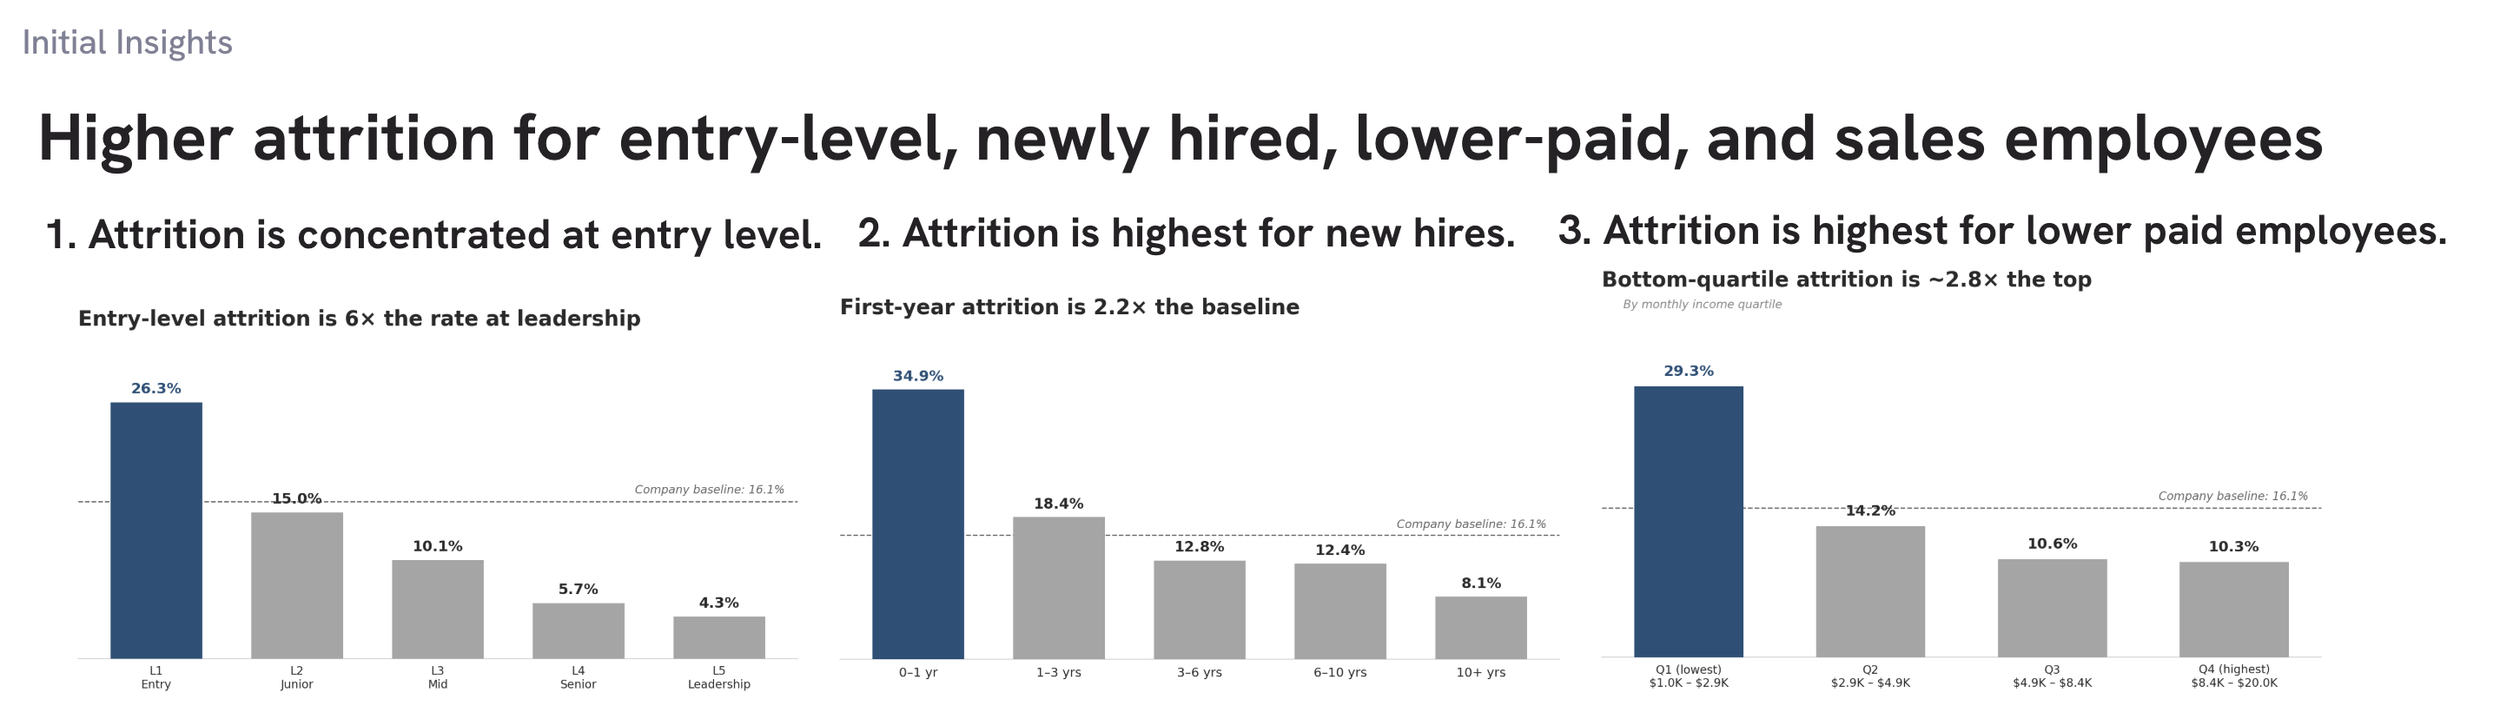
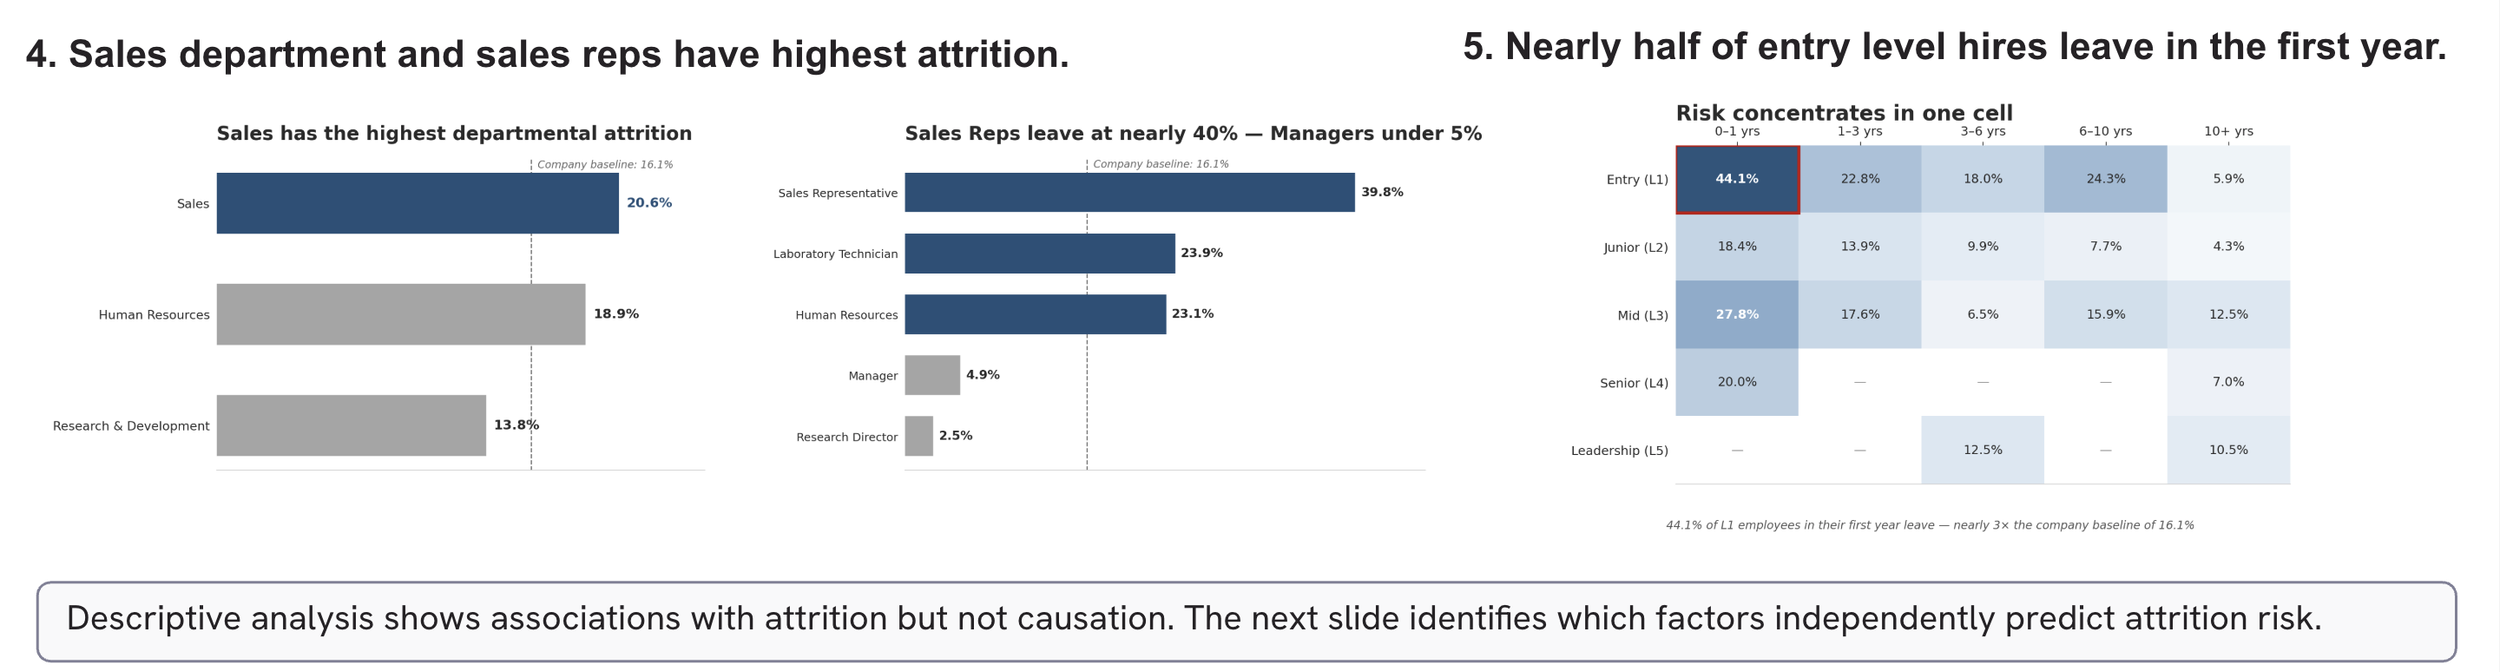
Where risk concentrates
Descriptive analysis (separate from the inferential model) showed that risk concentrated in identifiable populations: entry-level employees, new hires, lower-paid employees, and sales representatives. These descriptive patterns helped scope the recommendation but were not used as causal claims.
Recommendation: OT reduction + career progression
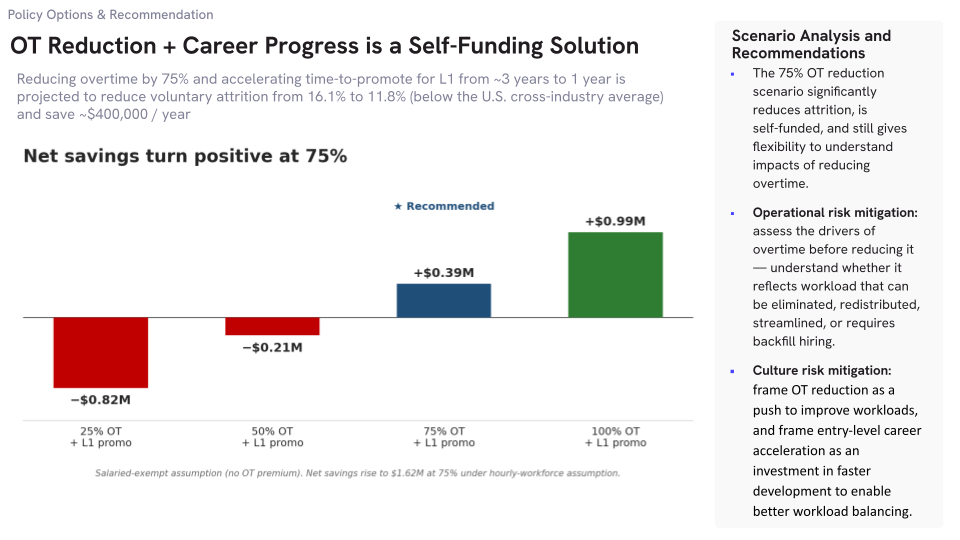
The recommended intervention combined two levers: a 75% reduction in overtime and an acceleration of L1→L2 promotion timeline from approximately three years to one year.
The projected impact is a reduction in voluntary attrition from 16.1% to 11.8% — below the US cross-industry average — retaining approximately 64 employees annually. Net annual savings ranged from $0.39M under salaried-exempt assumptions to $1.62M under hourly-workforce assumptions.
Sensitivity analysis showed that net savings turned positive at the 75% OT reduction threshold; lower thresholds (25%, 50%) reduced attrition but didn't fully offset the wage and replacement costs.